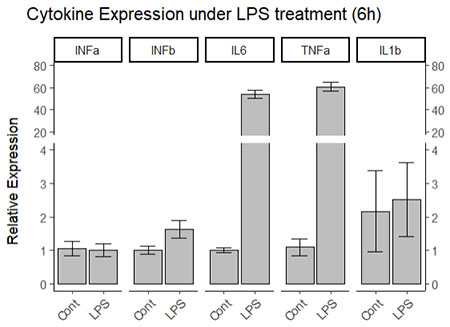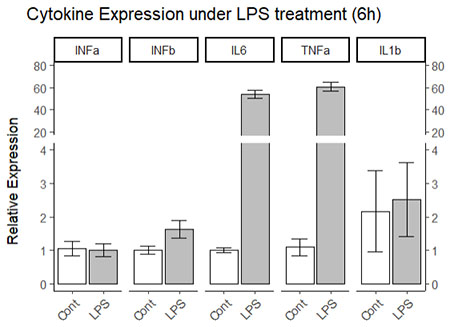
下記コードを書いて、scale_fill_manualでバーグラフの色を指定したけど、効かなかった。
p1 <- ggplot(df_6h, aes(x=Sample.name, y=Rel.Exp)) +
stat_summary(fun=mean, geom="bar", colour="black" ) +
scale_fill_manual(values=c("Cont"="white", "LPS"="gray"))
あれ?と思ってよく見たら、aestheticsのところでfill = ""を指定していなかった。
これ、個人的によくやってしまう。
aes(... fill = バーグラフの値)を指定したら解決した。
p1 <- ggplot(df_6h, aes(x=Sample.name, y=Rel.Exp, fill=Sample.name)) +
stat_summary(fun=mean, geom="bar", colour="black" ) +
scale_fill_manual(values=c("Cont"="white", "LPS"="gray"))

全体のコードは下記。
p1 <- ggplot(df_6h, aes(x=Sample.name, y=Rel.Exp, fill=Sample.name) ) +
stat_summary(fun=mean, geom="bar", colour="black") +
scale_fill_manual(values=c("Cont"="white", "LPS"="gray" )) +
stat_summary(fun="mean",
fun.min=function(x)mean(x) - sd(x)/sqrt(4),
fun.max=function(x)mean(x) + sd(x)/sqrt(4),
geom="errorbar",
position=position_dodge(.8), width=.5, size=.1, colour="black") +
labs(title="Cytokine Expression under LPS treatment (6h)", x="Sample", y="Relative Expression" ) +
theme_classic() +
theme(axis.text.x=element_text(angle=45, hjust=1)) +
facet_grid(~Gene, scales="free_y" ) +
theme(legend.position="none" ) +
scale_y_break(c(4,20), scale=0.5) +
ylim(0,80)

