facet_wrap
で3グループのグラフに分けて、ボックスプロットを作った。
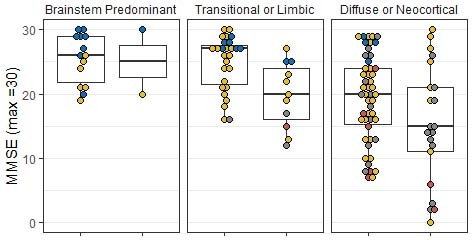
MMSE <- filter(Data, complete.cases(Disease), complete.cases(LBD_Subtype)) %>%
ggplot(aes(x = Disease, y = MMSE)) +
geom_boxplot(outlier.shape  =  NA) +
ggbeeswarm::geom_beeswarm(shape = 21, aes(fill = Phenotype), cex = 3.8, size = 2.3) +
theme_bw() +
labs(x = "", y = "MMSE (max = 30)") +
scale_fill_jco()+facet_wrap(~LBD_subtype)+
theme(strip.background  =  element_blank(), panel.grid.major.x = element_blank())

ggsave(file = "MMSE_LBDsubtype_dot.eps") #EPSで出力
出来上がったグラフはこんな感じ ▼
このグラフの並びを、左から
- "Brainstem Predominant"
- "Diffuse or Neocortical"
- "Transitional or Limbic"
という並びから、
- "Brainstem Predominant"
- "Transitional or Limbic"
- "Diffuse or Neocortical"
という並びに並び替えたい時。
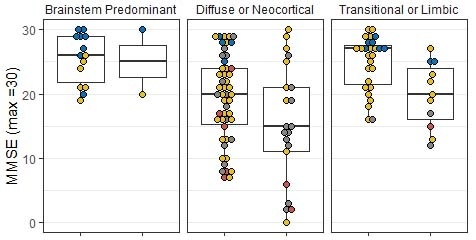
Transformを使って並び替え
1.任意の文字列(今回は "Order")に、transform でレベルを指定する。
Order <- transform(Data, LBDsubtype = factor(LBD_Subtype, levels = c("Brainstem Predominant", "Transitional or Limbic", "Diffuse or Neocortical" )))
2.もとのデータ ("Data") の代わりに、並び替えたデータ ("order") を指定して、ボックスプロットを作る。
MMSE <- filter(Order, complete.cases(Disease), complete.cases(LBD_Subtype)) %>%
ggplot(aes(x = Disease, y = MMSE)) +
geom_boxplot(outlier.shape  =  NA) +
ggbeeswarm::geom_beeswarm(shape = 21, aes(fill = Phenotype), cex = 3.8, size = 2.3) +
theme_bw() +
labs(x = "", y = "MMSE (max = 30)") +
scale_fill_jco()+facet_wrap(~LBD_Subtype)+
theme(strip.background = element_blank(), panel.grid.major.x = element_blank())
ggsave(file="Fig3_MMSEinDisease_LBDsubtype_dot.eps") #EPSで出力
3.目的の並び順に変更できた▼
References
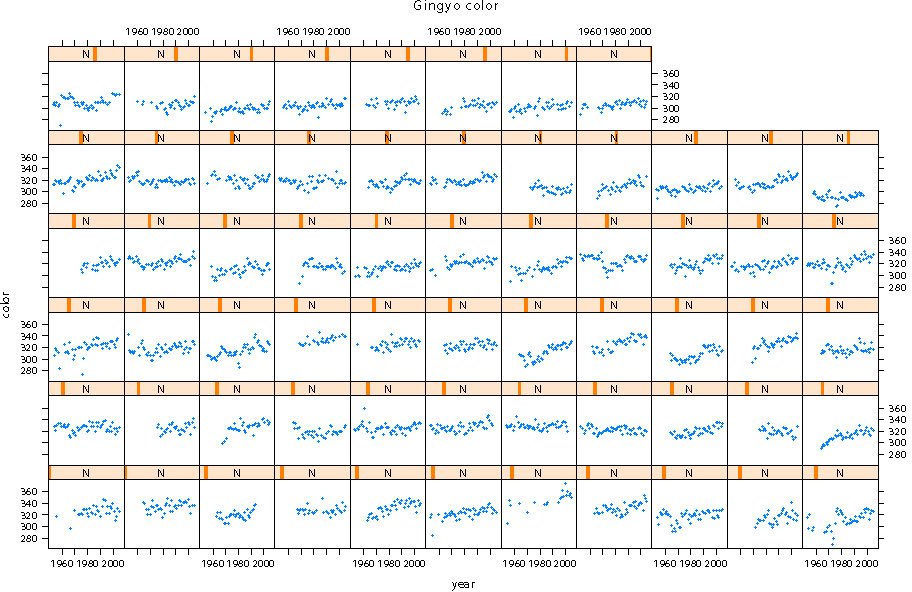
One of the most powerful aspects of the R plotting package ggplot2 is the ease with which you can create multi-panel plots. With a single function you can split a single plot into many related plot…
lattice plot便利ですね。でも、思った順番に図が並んでくれない…と言う時はdata.frameの方をfactor(, levels=c(...)...
リンク
リンク
リンク
リンク