最近はどのジャーナルからも「棒グラフにはプロットを重ねるように」と言われると思う。
私自身、プロットしていないと気持ちが悪い。
で、その方法 ↓
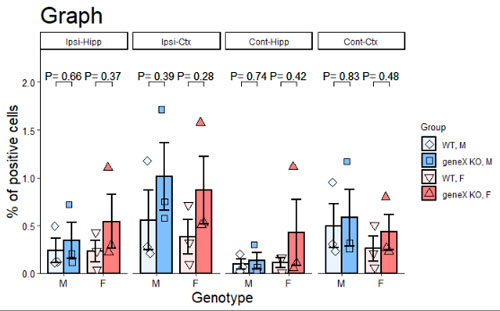
棒グラフにプロットを重ねる
棒グラフだけだと mean とかのデータを使うけど、プロットを重ねる時はボックスプロットなどと同じ様に生データのデータフレームを使う。
(コード内では、表の上にもっていきたい方を後ろの方に書く。)
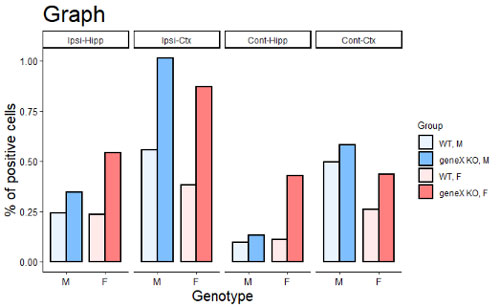
棒グラフの部分は、
stat_summary()geom = "bar"(今回、オスとメスとでそれぞれグルー化して表示したかったので、
aes(x = 性別, fill = グループのデータ, group = グループのデータ) = "dodge"position = "dodge"さらに特定の領域毎に分けて表示したかったので、
facet_grid(~部位名)Data %>%
ggplot(
aes(x = Sex,
y = NFT,
fill = Group,
group = Group
)
) +
stat_summary(
fun = "mean", # 値は平均値で表示
geom = "bar", # 棒グラフにする
width = .8, # 棒の幅を .8 に設定
position = "dodge", # 棒グラフを性別で固めてグループ毎に横に並べる
colour = "black", # 棒グラフの線の色
size = 1 + # 棒グラフの線の太さ
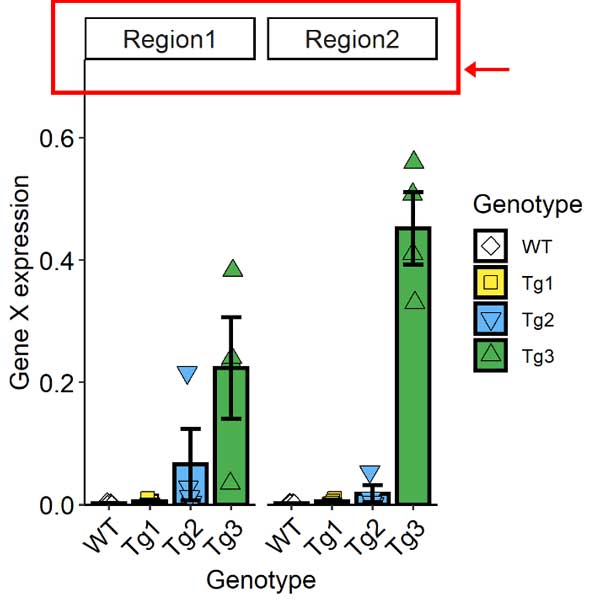
facet_grid(~ Region, scales = "free") # Region 毎にグラフを分ける
)
ここに、
geom_point()プロット同士の重なりを防ぐため、
position = position_jitterdodge()geom_point(
position = position_jitterdodge(
jitter.width = .5, # プロットの横の散らばり具合を .5 に設定
jitter.height = 0 # プロットの縦の散らばり具合は絶対 0 に。じゃないと嘘のプロットを表示することになる。
),
size = 3, # プロットのサイズ
colour = "black", # プロットの線の色
aes(shape = Group) # プロットの形をどのデータでわけるか
) +
scale_shape_manual( # プロットの形をマニュアルで設定
values = c(23, 22, 25, 24)
)
プロットの形は、下記参照。
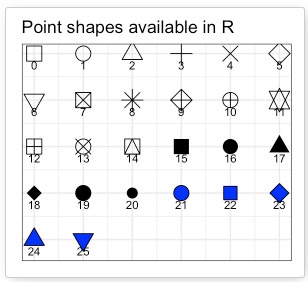
- 0-4 は白抜き。
- 5-20 は黒で塗りつぶし。
- 21-25 はマニュアルで色を設定。
私は棒グラフの色と合わせたかったので、23, 22, 25, 24 を選択。
色は、先にしてしていた
scale_fill_manual()
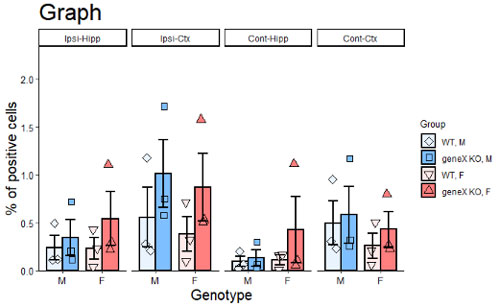
できあがり。
さらに P値も入れておく。(今回全部有意差なし。)
・
・
・
全体のコードは下記 ↓
Data %>%
  ggplot(
    aes(x = Sex,
        y = NFT,
        fill = Group,
        group = Group
        )
    ) +
  stat_summary(
    fun = "mean",
    geom = "bar",
    width = .8,
    position = "dodge",
    colour = "black",
    size = 1
    ) +
   scale_fill_manual(
    values = c("#eaf4ff", "#7fbfff", "#ffeaea", "#ff7f7f")
    )  +
  facet_grid(~ Region, scales = "free") +
    #theme_bw() +
  theme_classic() +
  theme(
    title = element_text(size = 20),
    legend.title = element_text(size = 10),
    axis.title.x = element_text(size=15),
    axis.title.y = element_text(size=15),
    axis.text.x = element_text(size=10, colour = 1),
    axis.text.y = element_text(size = 10, colour = 1),
      ) +
    labs(
    title = "Graph",
    x = "Genotype",
    y = "% of positive cells") +
  geom_point(
    position = position_jitterdodge(
      jitter.width = .5,
      jitter.height = 0
      ),
    size = 3,
    colour = "black",
    aes(shape = Group)
    ) +
  scale_shape_manual(
    values = c(23, 22, 25, 24)
    ) +
  stat_summary(
    fun = "mean",
    fun.min = function(x)mean(x) - sd(x)/sqrt(3),
    fun.max = function(x)mean(x) + sd(x)/sqrt(3),
    geom = "errorbar", position = position_dodge(.8),
    width = .5, size = 1,
    colour = "black",
    ) +
  scale_y_continuous(
    expand=c(0,0),
    limits = c(0, (max(Data$NFT) + sd(Data$NFT))*1.1)
    ) +
  geom_signif(data = data.frame(Group = c("WT, M", "geneX KO, M", "WT, F", "geneX KO, F")),
             aes(
               y_position=c(2, 2, 2, 2, 2, 2, 2, 2, 2, 2, 2, 2, 2, 2, 2, 2),
               xmin=c(0.8, 1.8, 0.8, 1.8, 0.8, 1.8, 0.8, 1.8, 0.8, 1.8, 0.8, 1.8, 0.8, 1.8, 0.8, 1.8),
               xmax=c(1.2, 2.2, 1.2, 2.2, 1.2, 2.2, 1.2, 2.2, 1.2, 2.2, 1.2, 2.2, 1.2, 2.2, 1.2, 2.2),
               annotations=c(
                 paste("P=", round(NFT_M_ttest_Ipsi_Hipp$p.value,2)),
                 paste("P=", round(NFT_F_ttest_Ipsi_Hipp$p.value,2)),
                 paste("P=", round(NFT_M_ttest_Ipsi_Hipp$p.value,2)),
                 paste("P=", round(NFT_F_ttest_Ipsi_Hipp$p.value,2)),
                 paste("P=", round(NFT_M_ttest_Ipsi_Ctx$p.value,2)),
                 paste("P=", round(NFT_F_ttest_Ipsi_Ctx$p.value,2)),
                 paste("P=", round(NFT_M_ttest_Ipsi_Ctx$p.value,2)),
                 paste("P=", round(NFT_F_ttest_Ipsi_Ctx$p.value,2)),
                 paste("P=", round(NFT_M_ttest_Cont_Hipp$p.value,2)),
                 paste("P=", round(NFT_F_ttest_Cont_Hipp$p.value,2)),
                 paste("P=", round(NFT_M_ttest_Cont_Hipp$p.value,2)),
                 paste("P=", round(NFT_F_ttest_Cont_Hipp$p.value,2)),
                 paste("P=", round(NFT_M_ttest_Cont_Ctx$p.value,2)),
                 paste("P=", round(NFT_F_ttest_Cont_Ctx$p.value,2)),
                 paste("P=", round(NFT_M_ttest_Cont_Ctx$p.value,2)),
                 paste("P=", round(NFT_F_ttest_Cont_Ctx$p.value,2))
                 )
               ),   #a, b, a, b, c, d, c, d,... と記載すべし
             tip_length=.02,
             manual = T)
リンク
リンク
リンク
リンク