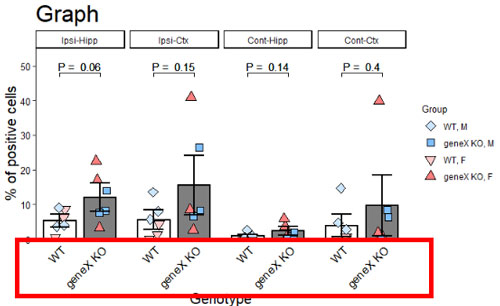
下記グラフのx軸ラベルを斜めにしたい場合。
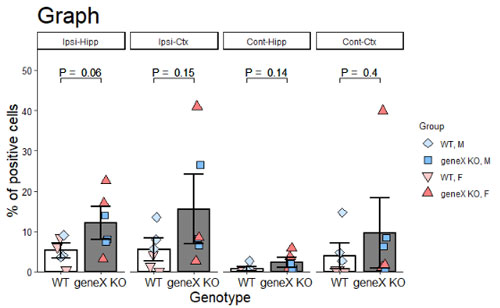
theme(axis.text.x = element_text(angle = 角度, hjust = 高さの調節))を追加する。
theme(axis.text.x = element_text(angle = 45))
angle だけ指定すると、文字は真ん中で回転する。
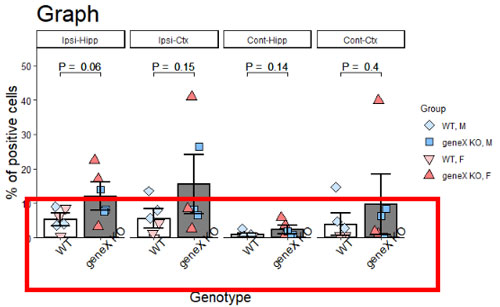
なので、高さも指定。
theme(axis.text.x = element_text(angle = 45, hjust = 1))
・
・
・
全体のコードは下記
Graph <- Graph %>%
    ggplot(
    aes(x = Genotype,
    y = Expression,
    fill = Group,
    group = Genotype
    )
    ) +
    stat_summary(
    fun = "mean",
    geom = "bar",
    width = .8,
    colour = "black",
    position = "dodge",
    size = 1,
    fill = c("#fefefe", "#7f7f7f", "#fefefe", "#7f7f7f", "#fefefe", "#7f7f7f", "#fefefe", "#7f7f7f")
    ) +
    geom_point(
    position = position_jitterdodge(
    jitter.width = 1,
    jitter.height = 0
    ),
    size = 3.5,
    colour = "black",
    aes(shape = Group)
    ) +
    stat_summary(
    fun = "mean",
    fun.min = function(x)mean(x) - sd(x)/sqrt(3),
    fun.max = function(x)mean(x) + sd(x)/sqrt(3),
    geom = "errorbar", position = position_dodge(.8),
    width = .5, size = 1,
    colour = "black",
    ) +
    scale_shape_manual(
    values = c(23, 22, 25, 24)
    ) +
    scale_fill_manual(
    values = c("#cce5ff", "#7fbfff", "#ffcccc", "#ff7f7f")
    ) +
    scale_y_continuous(
    expand=c(0,0),
    limits = c(0, (max(Graph$Expression) + sd(Graph$Expression))*1.1)
    ) +
    labs(
    title = "Graph",
    x = "Genotype",
    y = "% of positive cells") +
    theme_classic() +
    theme(
    title = element_text(size = 20),
    legend.title = element_text(size = 10),
    axis.title.x = element_text(size = 15),
    axis.title.y = element_text(size = 15),
    axis.text.x = element_text(size = 12, colour = 1, angle = 45, hjust = 1),
    axis.text.y = element_text(size = 10, colour = 1),
    ) +
    geom_signif(data = data.frame(Genotype = c("WT", "geneX"), Group = c("WT, M", "geneX, M", "WT, F", "geneX, F")),
    aes(
    y_position=c(48, 48, 48, 48,48, 48, 48, 48, 48, 48, 48, 48,48, 48, 48, 48),
    xmin=c(1, 1, 1, 1, 1, 1, 1, 1, 1, 1, 1, 1, 1, 1, 1, 1),
    xmax=c(2, 2, 2, 2, 2, 2, 2, 2, 2, 2, 2, 2, 2, 2, 2, 2),
    annotations=c(
    paste("P = ", round(Expression_ttest_Ipsi_Hipp$p.value,2)),
    paste("P = ", round(Expression_ttest_Ipsi_Hipp$p.value,2)),
    paste("P = ", round(Expression_ttest_Ipsi_Hipp$p.value,2)),
    paste("P = ", round(Expression_ttest_Ipsi_Hipp$p.value,2)),
    paste("P = ", round(Expression_ttest_Ipsi_Ctx$p.value,2)),
    paste("P = ", round(Expression_ttest_Ipsi_Ctx$p.value,2)),
    paste("P = ", round(Expression_ttest_Ipsi_Ctx$p.value,2)),
    paste("P = ", round(Expression_ttest_Ipsi_Ctx$p.value,2)),
    paste("P = ", round(Expression_ttest_Cont_Hipp$p.value,2)),
    paste("P = ", round(Expression_ttest_Cont_Hipp$p.value,2)),
    paste("P = ", round(Expression_ttest_Cont_Hipp$p.value,2)),
    paste("P = ", round(Expression_ttest_Cont_Hipp$p.value,2)),
    paste("P = ", round(Expression_ttest_Cont_Ctx$p.value,2)),
    paste("P = ", round(Expression_ttest_Cont_Ctx$p.value,2)),
    paste("P = ", round(Expression_ttest_Cont_Ctx$p.value,2)),
    paste("P = ", round(Expression_ttest_Cont_Ctx$p.value,2))
    )
    ),
    tip_length = .02,
    manual = T) +
    facet_grid(~ Region, scales = "free")
はじめに メモです。 やってみた theme(axis.text.x = element_text(angle = 45, hjust = 1))の部分です。 g <- ggplot(dat, aes(x=ind,...

リンク
リンク
リンク
リンク