医学臨床系論文の Table 1. は、たいてい "Patient Demographics"…
その "Table 1" を作るために非常に便利な R パッケージ: tableone。
基本的な使い方は、下記参照 ▼
今回は疫学などヒトを対象とした研究で対象者の特性として、主な変数の要約することが多くありますが、その表1(table1)を描き、csvとして出力できる便利な関数の紹介です。 その便利な関数はCreateTableOne()関数です。(パッケージはtableoneと言うものです) 早速、インストールします install.packages("tableone") library(tableone) 今回の模擬データ(Indian Liver Patients Dataset(https://archive.ics.uci.edu/ml/datasets/ILPD+(Indian+Liver+Pa…

今回はちょっと躓いたところと、その解決法を書き留めておく。
tableone を使う時に躓いた事とその解決法
私は、tableone と flextable の組み合わせで作表している。
tableone で基本情報を出力し、その後必要な情報を加えて、最後に flextable で出力、というイメージ。
Toggle = T が便利
e.g. とあるデータ。
Data_AD %>%
        tableone::CreateTableOne(vars = c(
        "Sex",
        "Age",
        "DiseaseDuration",
        "BrainWeight",
        "HS",
        "LBDSubtype",
        "ADNC"
        ),
        strata = "LATE",
        factorVars = c(
        "Sex",
        "HS",
        "LBDSubtype",
        "ADNC"
        ),
        testExact= T,
        testNonNormal = "wilcox.test"
        ) %>%
        print(nonnormal = T, printToggle = T, contDigits = 1, na.print = "") %>%
        as.data.frame() %>%
        mutate("AD cohort" = c(
        "n",
        "Sex (n, %)",
        "Age at death (y, IQR)",
        "Disease duration (y, IQR)",
        "Brain Weight (y, IQR)",
        "Hippocampal sclerosis",
        "LBD subtype",
        "ADNC (n, %)",""
        )) %>%

        dplyr::select("AD cohort", "LATE(+)", everything(), -test) %>%

        flextable::regulartable() %>%
        flextable::theme_booktabs() %>%
        flextable::font(fontname = "serif", part = "all") %>%
        flextable::autofit()
ここで、
print(nonnormal = T, printToggle = T, contDigits = 1, na.print = "")printToggleこれがヒントになって、エラーポイントを同定しやすくなる。
要素が2つだけの項目の表示法: showAllLevels = TRUE
例えば、性別を表示する時、男女どちらか片方だけの情報があればもう片方もわかるので、通常は片方の性だけを表示する。
けれども、他の項目で、両方の要素を表示したい場合も多い。
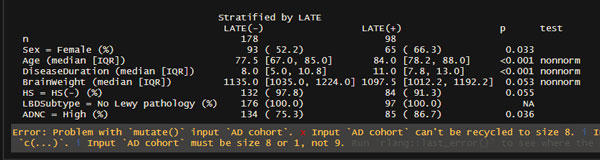
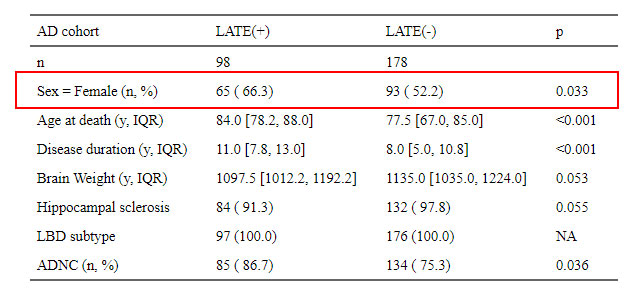
例えば下記の場合、AD コホートなので ADNC の4分類 "Not", "Low", "Int", "High" のうち、"Int" と "High" の患者さんしかいない。
なので、上の方の factor、"ADNC = High" のデータのみが表示されることになる。
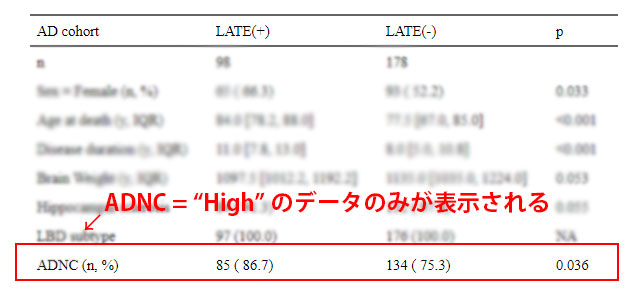
ここは、"Int" と "High" 両方のデータを表示したい。
そんな時は、
print()showAllLevels = TRUEprint(nonnormal = T, printToggle = T, contDigits = 1, na.print = "", showAllLevels = TRUE)Data_AD %>%
tableone::CreateTableOne(vars = c(
"Sex",
"Age",
"DiseaseDuration",
"BrainWeight",
"HS",
"LBDSubtype",
"ADNC"
),
strata = "LATE",
factorVars = c(
"Sex",
"HS",
"LBDSubtype",
"ADNC"
),
testExact= T,
testNonNormal = "wilcox.test"
) %>%
print(nonnormal = T, printToggle = T, contDigits = 1, na.print = "", showAllLevels = TRUE) %>%
as.data.frame() %>%
mutate("AD cohort" = c(
"n",
"Sex (n, %)","",
"Age at death (y, IQR)",
"Disease duration (y, IQR)",
"Brain Weight (y, IQR)",
"Hippocampal sclerosis","",
"LBD subtype",
"ADNC (n, %)",""
)) %>%
dplyr::select("AD cohort", level, "LATE(+)", everything(), -test) %>%
flextable::regulartable() %>%
flextable::theme_booktabs() %>%
flextable::font(fontname = "serif", part = "all") %>%
flextable::autofit()
これで、全ての要素が出力されるので、それに合わせて下記事項を調節。
1.
mutate()
の数を、データの数に揃える
mutate()増えた要素の分だけ
"" "",mutate("AD cohort" = c(
"n",
"Sex (n, %)","",
"Age at death (y, IQR)",
"Disease duration (y, IQR)",
"Brain Weight (y, IQR)",
"Hippocampal sclerosis","",
"LBD subtype",
"ADNC (n, %)",""
))
このとき
Toggle = T2. "level" の位置を入れ替える
"level" という列が追加で表示されるので、項目名列のとなりにくるように調節。
dplyr::select("AD cohort", level, "LATE(+)", everything(), -test)3. "level" の表示を消す
"level" という列名はいらないので、
rename()dplyr::rename(" "=level)
出力された表 ▼
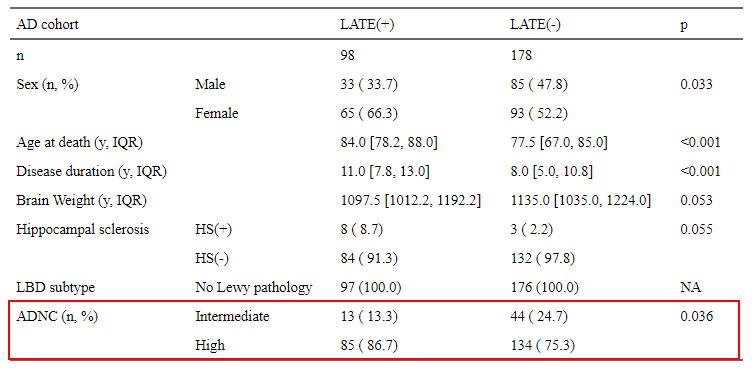
無事に "ADNC" の "Int" と "High" が表示された。
リンク
リンク
リンク
リンク