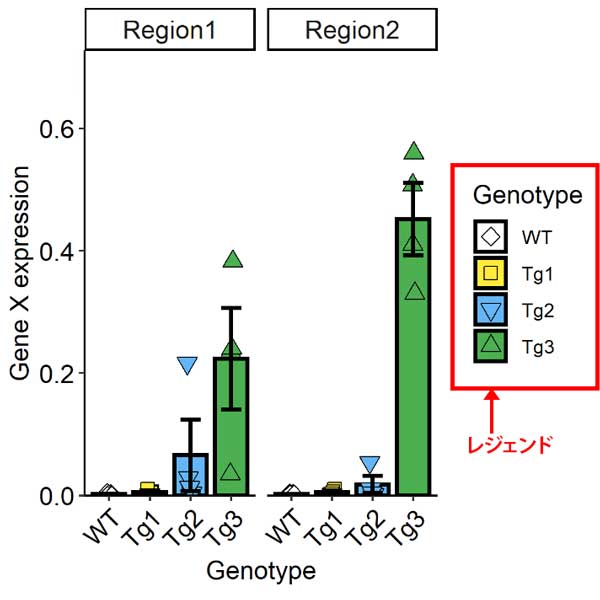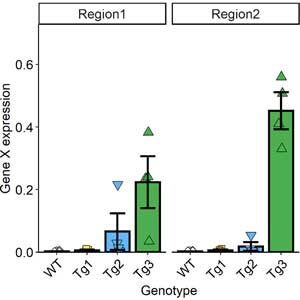
グラフを作っていて、「レジェンド要らないな」と思って消した時の備忘録。

方法はいくつかあるけど、使い勝手が良かったのは、themeに "legend.position = "none"を追加する方法。
theme(legend.position = "none")これで、レジェンドが消えて、その分グラフの専有面積が水平方向に拡大した。

全体のコード↓
G_M <- subset(G, G$Sex=="M")
G_M <- ggplot(G_M,
    aes(x = Genotype,
        y = Pathol,
        fill = Genotype
        )
    ) +
  stat_summary(
    fun = "mean",
    geom = "bar",
    width = .8,
    colour = "black",
    position = "dodge",
    size = 1
    ) +
    geom_point(
    position = position_jitterdodge(
      jitter.width = .5,
      jitter.height = 0
      ),
    size = 3,
    colour = "black",
    aes(shape = Genotype)
    ) +
  scale_shape_manual(
    values = c(23, 22, 25, 24)
    ) +
  stat_summary(
    fun = "mean",
    fun.min = function(x)mean(x) - sd(x)/sqrt(3),
    fun.max = function(x)mean(x) + sd(x)/sqrt(3),
    geom = "errorbar", position = position_dodge(.8),
    width = .5, size = 1,
    colour = "black",
    ) +
  scale_y_continuous(
    expand = c(0,0),
    limits = c(0,(max(G$Pathol)*0.4))
   ) +
  labs(
    title = "Male",
    x = "Genotype",
    y = "Gene X expression"
    ) +
  #theme_bw() +
  theme_classic() +
    theme(
    title = element_text(size = 12),
    legend.title = element_text(size = 12),
    axis.title.x = element_text(size = 12),
    axis.title.y = element_text(size = 12),
    axis.text.x = element_text(size = 12, colour = 1, angle = 45, hjust = 1),
    axis.text.y = element_text(size = 12, colour = 1),
    strip.text = element_text(size = 12)
      ) +
    scale_fill_manual(
    values = c("#FFFFFF", "#FFEB3B", "#64B5F6", "#4CAF50")
    ) +
  theme(legend.position = "none") +
  facet_grid(~ Region, scales = "free")
  #facet_wrap(~ Region, scales = "free")

  ggsave(G_M, file="name.tiff", path = "Export", width = 4 , height = 4.2, dpi=300)


