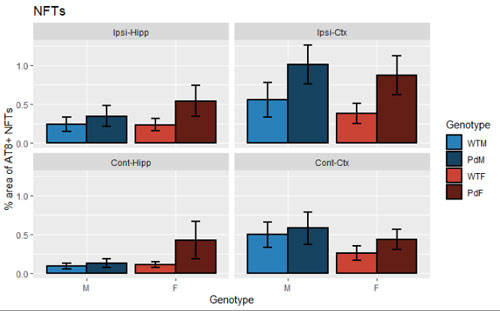
とある棒グラフを作成。
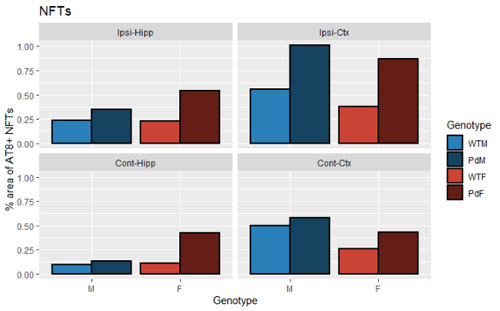
このグラフにエラーバーを付けたい場合、
geom_errorbar()エラーバーをつける
標準偏差(standard deviation, SD)
SDは、
dplyr::summarise(新規作成列名 = sd(参照データの列))で求める。
dplyr::summarise(mean = mean(Data), sd = sd(Data))で、このSDの値をエラーバーにするには、
geom_errorbar(aes(ymax = 平均値 + エラーバー値(上), ymin = 平均値 - エラーバーの値(下)), position = 位置, width = 横の線の長さ, size = 先の太さ)を追加する。
geom_errorbar(aes(ymax = mean + sd, ymin = mean - sd), position = position_dodge(0.9), width = 0.2, size = 0.75 )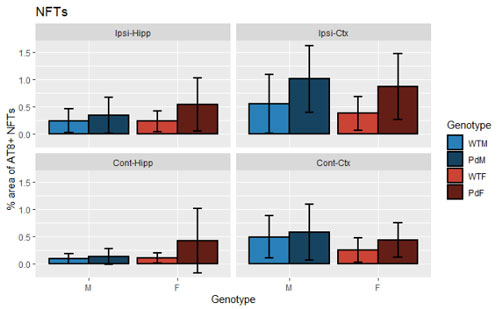
標準誤差(standard error of the mean, SEM)
SEMは、「標準偏差 ÷ ルート(サンプル数)」なので、
dplyr::mutate()で列を追加する。
mutate(Data, sem = sd/sqrt(6))で、新たに作ったSEMの列を、グラフのエラーバーの指示で指定する。

・
・
・
全体のコードは下記↓
# bar graphs
Data$Group <- factor(Data$Group, levels=c("WTM", "PdM" , "WTF" , "PdF" )) Data$Region <-
factor(Data$Region, levels=c("Ipsi-Hipp", "Ipsi-Ctx" , "Cont-Hipp" , "Cont-Ctx" )) Data %>%
ggplot(aes(x = reorder(x = Sex, X = Group), y = mean, fill = Group)) +
geom_col(position = "dodge", colour = "black", size = 0.75) +
geom_errorbar(aes(ymax = mean + sem, ymin = mean - sem), position = position_dodge(0.9), width = 0.2,
size = 0.75 ) +
labs(title = "Datas", x = "Genotype", y = "% area of AT8+ Datas", fill="Genotype") +
scale_x_discrete(limit = c("M", "F")) +
scale_fill_discrete(limit = c("WTM", "PdM", "WTF", "PdM")) +
scale_fill_manual(values = c("#2980B9", "#154360", "#CB4335", "#641E16")) +
facet_wrap(~Region)
リンク
リンク
リンク
リンク

![【R Markdownトラブルシュート】Error in parse_block(g[-1], g[1], params.src, markdown_mode)](https://mom-neuroscience.com/wp-content/uploads/2022/04/220423-RMarkdown-logo-1.png)
